Weather Fundamentals

Weather Fundamentals
Temperature
Heat
Latent Heat
Heat Transfer
Heat Sources
Daily Temperature Cycle
Latitude and Longitude
Declination
The Seasons
Global Effects
Temperature Statistics
Temperature
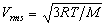
As shown in the relationship, temperature is related to the motion of molecules. Molecules in a gas travel faster at higher temperature. Relationships like the one above define temperature on the Kelvin ( o K) scale. At a temperature of 0 o K there is no molecular motion and temperatures less than 0 o K are undefined. The Kelvin scale must be used when calculating with equations like the one above. The Fahrenheit scale ( o F) was devised in 1753. On this scale at 1 atmosphere pressure, pure water melts from ice at 32 o F and boils at 212 o F.
The Celsius scale ( o C) was devised in 1850 as part of the metric system. At 1 atmosphere pressure pure water melts from ice at 0 o C and boils at 100 o C. The Celsius scale is preferred for scientific measurement and is used to report air temperature in most of the world -- except USA. Centigrade is an obsolete name for the Celsius scale.
The Celsius and Kelvin scales use the same size degree. A change of 1 o C is the same as a change of 1 o K. 0 o C is the same temperature as 273.15 o K.
Conversion between o F and o C is complicated by the fact that the scales differ both in degree size and in the zero point. On neither of these scales does it make much sense to say 60 o is twice as hot as 30 o . (The two scales give the same reading at - 40 o .)
Heat
Heat is a form of energy. The amount of heat depends on mass, on temperature, and on the nature of the substance involved.- A 1-liter jar of water at 20 o C contains the same amount of heat as another 1-liter jar of water at 20 o C
- A 2-liter jar of water at 20 o C contains twice as much heat as a 1-liter jar of water at 20 o C
- A 1-liter jar of water at 20 o C contains over 1000 times more heat than a 1-liter jar of dry air at 20 o C. 1 liter of water has a mass of 1,000g while 1 liter of dry air has a mass of 1.2g.
- A 1-liter jar of water at 40 o C does not contain twice as much heat as a 1-liter jar of water at 20 o C. 1 cal of heat is needed to warm 1g of water by 1 o C. This is called water’s specific heat. 20,000cal are needed to warm 1 liter (1,000g) of water by 20 o C.
- 1 liter of water at 0 o C contains 136,500cal of heat -- not 0 cal. (The notes do not show you how to calculate this number.) 1 liter of water at 20 o C thus contains 156,500cal and 1 liter of water at 40 o C con-tains 176,500cal.
Liquid water has an unusually high specific heat. (This has a number of consequences in discussing weather. For now, just keep this in mind.)
Latent Heat
Heat 1 liter of water. For every 1,000cal of heat absorbed the temperature rises by 1 o C. But when the temperature reaches 100 o C the temperature stops rising even though more heat is applied. Each 540 cal of heat absorbed by liquid water at 100 o C produces 1g of steam at 100 o C. The 540 cal/g is called the heat of vaporization because it goes into converting liquid to vapor rather than raising the temperature.- The 540 cal/g is not lost. It is returned in exact amount when the steam condenses back to water at 100 o C. This is an example of latent heat.
- Much latent heat is used to evaporate water in the tropics and released when the vapor is carried towards the poles and re-precipitated. This allows large amounts of heat to be moved very efficiently.
- Liquid water can be converted to vapor at any temperature; it does not have to be heated to 100 o C. At 0 o C 595 cal/g will convert liquid water to vapor at 0 o C.
- 80 cal/g of heat, called the (latent) heat of fusion is involved in the conversion between ice and liquid water. The heat is absorbed to melt the ice and recovered when the water freezes.
Heat Transfer
Heat can be transferred by conduction, by convection, and by radiation. The heat always moves from high temperature towards lower temperature.Conduction
In conduction vibration or thermal motion of molecules in a hot region is transferred to nearby molecules in a cooler region. There is no bulk movement of material. Materials which favor this process -- including most metals -- are good conductors. Materials which retard conduction of heat are called insulators. Rock, soil, glass, and most ceramics are good insulators. Dry air -- confined so that it doesn’t flow -- is an excellent insulator.A thin layer of air is heated or cooled by conduction in contact with the ground.
Convection
Materials expand and lose density when heated. A heated fluid (liquid or gas) becomes less dense and can rise upwards, displacing cooler fluid which then sinks. This vertical motion carrying heat is called convection. If the motion is mostly horizontal the transfer is called advection. Both processes are very important in the atmosphere.Radiation
Objects can be heated by absorbing electromagnetic waves and they can be cooled by emitting electromagnetic waves. Either process is called radiation.Radiation is the only process that can move heat across empty Space. Earth’s surface and atmosphere are heated by radiation from the Sun. Earth’s surface and atmosphere also radiate heat back into Space -- maintaining an equilibrium temperature.
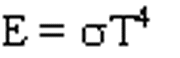
A hot body radiates energy (E) much more efficiently than a cooler body.
Ideally the relationship is given by the Stefan-Boltzman Law:
As Earth warms from solar heating it radiates heat back into space more efficiently. Eventually it radiates back as much energy as it receives and the temperature stops changing.
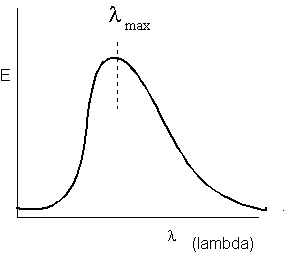
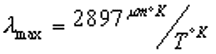
The figure shows that a heated object radiates energy (E) across a broad spectrum of wavelengths ( lambda). Emission drops sharply towards the short wavelengths but spreads broadly through the longer wavelengths. A simple equation called Wien’s Law describes the position of lambda max , the wavelength at which the most energy is radiated
As shown by Wien’s Law, a hot body radiates energy at shorter wavelengths than does a cooler body. This can be very important. Earth’s atmosphere is transparent to the short waves that transmit the majority of the Sun’s energy. These rays strike and warm the ground surface. The heated ground radiates energy back into Space, but at longer wavelengths because the ground is much cooler than the Sun. These longer, infrared rays are absorbed by H 2 O, CO 2 , and CH 4 in the atmosphere. This greenhouse effect warms the atmosphere by about 33 o C (60 o F).
Heat Sources
As indicated by volcanoes, etc., Earth is hot inside. Some of this heat leaks out through the surface and is available for heating the atmosphere. This leakage of heat from inside the Earth amounts to 0.0143 cal through a square meter each second. If it were the only source of heat, Earth’s surface would have a temperature about -440 o F.
Put a 1 square meter solar panel in orbit above Earth’s atmosphere and face it squarely towards the Sun. Each second it will intercept 327 cal of heat (22,000 times more than the heat from leakage of Earth’s internal heat). Conclusion: Earth’s surface and atmosphere are heated by the Sun.
(Earth’s internal heat does have one effect on weather. Because heat always flows from hot towards cold, the solar heat penetrates only a few feet inside the Earth.)
Daily Temperature Cycle
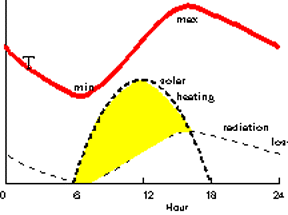
Consider the Earth’s surface on a calm, clear day. On this day the Sun rises at 6AM (6h), peaks at Noon (12h), and sets at 6PM (18h).
As shown by the heavy dashed, solar heating curve, the Sun immediately begins heating the surface. The greatest amount of solar heat is delivered at noon and the amount declines during the afternoon. After the Sun sets, no heat is delivered until the next dawn.
Not surprisingly, the surface temperature rises immediately but note that the highest temperature occurs sometime in mid-afternoon rather than at Noon when the solar heating is most intense. Why? According to the Stefan-Boltzman Law
-the surface radiates energy to space as long as it has a temperature above 0 o K ( - 460 o F). As heat radiates away at night the surface cools steadily becoming coolest just at dawn. This is shown by the light-dashed, radiation loss curve. The energy for this radiation comes from heat stored in the surface rock, soil, and water and in the air.
The heat that was "borrowed" overnight is "repaid" next morning. The shaded area between the two radiation curves represents solar heat that is going back into storage rather than heating the surface. Sometime in the afternoon as the solar heating declines, the heating and radiation-loss curves become equal. This marks the moment of highest surface temperature. For the rest of the day and night temperature must drop as stored energy is tapped.
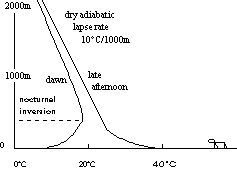
The figure at right shows how the daily solar heating cycle affects the air in clear weather with little wind. Dry air cools 10 o C as it rises 1000m; this is called the dry adiabatic lapse rate. Note also that still air is a good insulator -- a poor conductor of heat.
By day the ground surface absorbs solar radiation. Rock and soil are good insulators so the heat stays very close to the surface and the temperature rises. Very slowly this heat is conducted into the air near the ground but the higher air is only slightly warmed (temperature profile on right, above). On a calm, clear night the ground cools by radiating heat back into Space. The air near the cold ground cools slowly by conduction but the higher air cools only slightly. Eventually this can produce an inversion -- a region where temperature increases with altitude (profile on left, above).
Latitude and Longitude
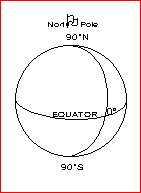
A meridian is a circle on the Earth that passes through both poles and any third point of your choice. Latitude is measured along any meridian as shown at right. The Equator is a circle drawn at right angles to the meridians at Latitude 0 o . Longitude is measured around the Equator west and east from a Prime Meridian ( = Greenwich Meridian) passing through London England.
NU Husky Statue lat 42.3410± 0.0005 o N long 71.089 o W
Declination
Earth’s Equator can be projected outwards to make a Celestial Equator. Declination is a measure of angular distance of celestial objects north or south of the Celestial Equator. Each star has a fixed, constant declination. During the course of each year, the Sun’s declination varies between +23.4 o (N) to -23.4 o (S). These extremes of declination mark the two Solstices. In-between are two Equinoxes when the Sun crosses the Celestial Equator. These four positions of the Sun mark the beginning of the Astronomical Seasons. They can be calculated precisely. In 1999 the Sun crossed the Vernal Equinox (Spring begins) on 20 March at 8:46PM EST.The Seasons
Earth’s orbit is slightly elliptical. At perihelion (closest to Sun) the distance from Earth to Sun is 147,000,000km. At aphelion (furthest from Sun) the distance is 152,000,000km. The difference is enough to change temperature on earth by up to 7 o F But note that Earth is at perihelion each year on 3 January and at aphelion about 4 July. Evidently distance to the Sun is not what causes Earth’s seasons.If Earth’s axis of daily rotation were perpendicular to the plane of its orbit around the Sun, then every place would have 12 hours of sunlight each day of the year. It would be cool at the poles and warm at the Equator but there would be no seasonal change during the year.
Earth’s axis of daily rotation is tipped 23.4 o from perpendicular to the plane of our orbit around the Sun. This is the underlying cause of the seasonal changes in our weather. It causes the Sun’s declination (see box above) to change from +23.4 o at the June Solstice to - 23.4 o at the December Solstice with values of 0 o at the two equinoxes. On flat ground two factors affect the amount of solar heating:
1) the number of hours of sunlight, and
2) the Sun’s elevation -- its height in degrees measured up from the horizon -- especially its elevation at noontime.
Both change at different latitudes on Earth and both change as the Sun’s declination changes during the year. Both can be calculated with the equation below
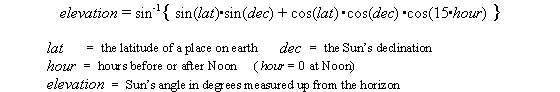
Results of such calculation are shown in the table. The rows show five latitudes from the Equator to the North Pole. The columns show five positions of the Sun from the June Solstice to the December Solstice. Each square shows the calculated hours of sunlight (top), the noon elevation of the Sun (middle), and the relative amount of solar heating (bottom).

Equator (lat. 0 o )
The noon sun is straight overhead at the two equinoxes and is high in the sky all year -- this promotes strong heating but each day of the year gets the same 12 hours of sunlight. During a year the amount of heating varies by only about 10%. There may be a wet season and a dry season but there is little variation in temperature during a year. In fact, the difference in day and night temperature is greater than the seasonal variation.Tropic of Cancer (lat. 23.4 o )
The noon Sun is straight overhead on the day of the June Solstice and as low as 43 o at the December Solstice. The longest day is only 1½ hours longer than 12 hours and the shortest day only 1½ hours less. The warmest day gets almost twice the heating of the coolest day but this is not a large variation. This is still a hot climate; heat for the whole year is only 10% less than at the Equator. Going south towards the Equator the seasonal variation is even less.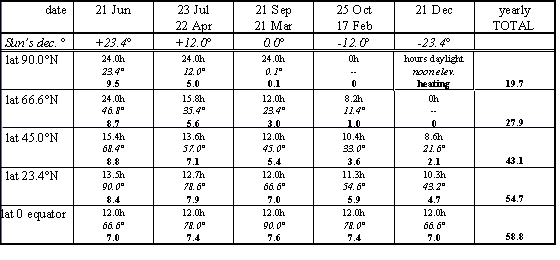
Latidude 45 o
(Boston at lat. 42 o N has seasons like this.) The seasonal variation is pronounced. The longest day is twice as long as the shortest day. On the longest day the noon sun delivers twice as much heat as on the shortest day. The combined effect is a 4x variation in daily solar heating over the year. During the warmest three months this latitude is heated more than the Equator at the same time. Over a year this latitude gets 75% as much heat as the Equator.
Arctic Circle (lat. 67 o )
On 21 June this latitude gets 24 hours of daylight (but then there is 21 December when the Sun fails to rise at all). During June the Sun is low in the northern sky most of the night and on the 21st it doesn’t set -- grazing the horizon due north at midnight. At noon on the 21st of June the Sun is 47 o above the southern horizon (about the same as Boston in late March). The long hours of daylight in Summer add up and during the warmest three months this latitude gets about 90% as much heat as the Equator. (But watch out for the coldest three months.) Over the course of a year this latitude gets about half as much solar heating as the Equator. Going north there are more days getting 24 hours of Summer daylight (balanced by the same number of Winter days with no Sun).
North Pole (lat. 90 o N)
In mid-March the Sun pokes above the horizon and circles 360 o each day. Each day the Sun is slightly higher until on 21 June it circles 360 o at 23 o above the horizon. Note that the Sun doesn’t rise and set each day -- it just circles at a constant elevation. In late September the Sun sinks below the horizon. At best, on 21 June the noon Sun is only 24 o above the horizon (about the same as Boston in late December). That’s a weak angle for solar heating but the long working hours make up and for a few weeks there is more heating here than at the Equator! But watch out for the long winters. (At low Sun angles, less than about 15 o , the light must travel long distances through the lower atmosphere with the possibility of heat being absorbed or reflected by clouds and haze. The actual heating of the Arctic ground is accordingly somewhat less than the results calculated above.)
Global Effects
Year-round the tropics maintain an average monthly temperature (see below) around 80 o F. In Summer the entire northern hemisphere is strongly heated by the Sun and even the high Arctic reaches an average July temperature of 40 o . The temperature gradient (drop) from Equator to North Pole is only 40 o F and the isotherms are broadly spaced.
In Winter the northern hemisphere receives little to no solar heating. January mean temperature at the North Pole drops to -30 to -40 o F (-50 o F in Siberia). The temperature gradient from Equator to North Pole is very steep and the isotherms are closely spaced.
In the next Chapter we will see that these global temperature gradients are directly related to global wind circulation.
Solar heating varies with latitude and the temperature isotherms in the main follow the parallels of latitude. Where they deviate, they do so because of
- land vs water (The oceans heat or cool slowly)
- ocean currents
- elevation
- advection, the lateral movement of warm or cool air masses
- the absorption of latent heat as water evaporates in the tropics and its release as the water precipitates in cooler regions
- warm and cold ocean currents transfer much heat because of water’s high specific heat.
Temperature Statistics
For each 24-hour day the maximum and minimum temperatures are measured to the nearest degree and recorded. The daily average is the arithmetic mean (average) of the daily maximum and minimum. The number is rounded down to the nearest integer (75.5 is recorded as 75 o ).- The monthly average is the arithmetic mean of the daily averages.
- The yearly average is the arithmetic mean of the twelve monthly averages.
- Normal is defined as the average of a reading over the past 30 years.